[ Performance ]

Your Inverter Sees the Loss. It Never Sees the Modules.

You know your plant is underperforming — you just don't know which modules, or why. SunSniffer shows where the electrical loss occurs, how it develops and which action is economically justified.

Aerial view · live
49.45°N · 11.08°E · 10.2 MWp
You see the loss · −3%
not the cause — so nothing changes
The Limits of Standard Monitoring

You Can See the Number. You Cannot See the Reason.

Inverter and string monitoring tell you how much energy you are producing. They cannot tell you why you are losing it — or which module is responsible.

Inverter
plant level
String Monitor
string level
SunSniffer
module level
Detects underperformance
An alarm fires when production drops
Inverter
String Monitor
SunSniffer
Localizes the loss
Shows the affected modules — supports targeted cause analysis
Inverter
String Monitor
SunSniffer
Module-level visibility
Sees every module individually, not averages
Inverter
String Monitor
SunSniffer
Separates soiling from degradation
Cleaning issue — or permanent damage?
Inverter
String Monitor
SunSniffer
Repeatable STC-equivalent comparison
Weather-independent, lab-referenced values
Inverter
String Monitor
SunSniffer✓ module by module
Warranty review evidence
Compared with the agreed baseline, method and threshold
Inverter
String Monitor
SunSniffer
Why the difference?

Inverters and string monitors measure actual production — they do not calculate STC-equivalent module performance. TrueSTC™ has been validated against laboratory flasher measurements from ZAE and the Helmholtz Institute Erlangen-Nürnberg: in the direct comparison of six normally operating modules, the mean observed absolute deviation was 0.82% across twelve comparisons — all twelve within ±2%. Full validation scope in Science

Thermal Imaging · The Blind Floor

A Thermal Image Is an Indication. SunSniffer Measures the Electrical Consequence.

Drone thermography captures one operating moment — every flight brings a new viewing geometry and changing irradiance, temperature, wind and reflections. The images must then be processed and mapped to the correct physical modules. SunSniffer measures every monitored module continuously and builds the electrical history automatically.

Drone thermography
SunSniffer
Periodic inspection
Continuous electrical measurement
Thermal indication
Module-level performance value
Changing flight conditions
Repeatable performance history
Separate image processing
Automated analytics
Manual module mapping
Every reading already assigned
Blind floor below the thermal threshold
Small electrical changes stay visible in the history
8.3%
uncertainty in thermography-derived power-loss estimates
< 5%
electrical losses below this fell into the method’s blind floor

In a published Helmholtz comparison, power-loss estimates derived from thermography carried 8.3% uncertainty — electrical losses below 5% were not reliably identified by the thermal assessment criteria.

Source: Teubner et al. (2017), Comparison of Drone-based IR-imaging with Module Resolved Monitoring Power Data, Energy Procedia 124, pp. 560–566

No thermal signature does not mean no electrical loss.
TrueSTC
TrueSTC™

Field Data. Lab-Referenced Comparison. Without Removing a Module.

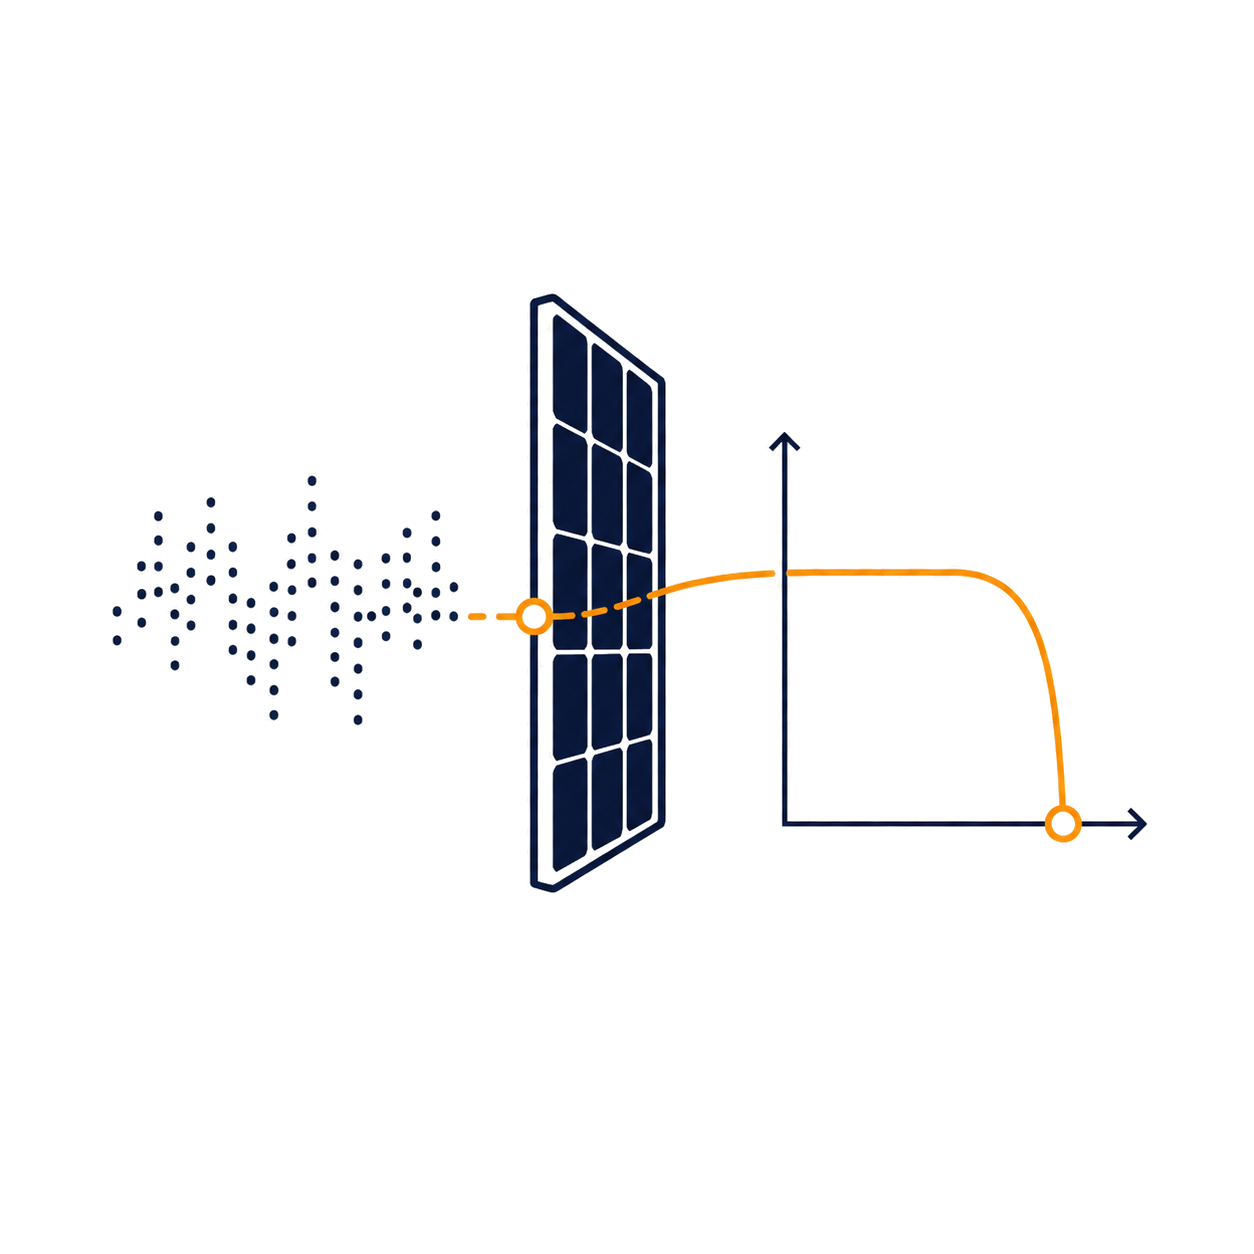
Measuring a module to STC standard used to mean sending an engineer on-site. Manual, expensive, and gone the moment they leave.

A laboratory flash is a high-quality reference — but it remains a snapshot, taken outside the module’s connected operation. One measurement, one day, one weather window.

TrueSTC™ works differently. Because SunSniffer measures every module continuously, thousands of suitable data points accumulate across changing irradiance and temperature. Datasheet mode enables a fast start; individual flasher values strengthen the absolute reference — and the continuous history reveals degradation, cleaning effects and event-related changes over time.

When you need the number, it is already there.

0.82%
Mean observed absolute deviation — 12 direct laboratory comparisons of six normally operating modules.
+0.60%
Clean campaign mean reconstructed after one-point individual referencing of 20 modules.
0.9%
Soiling-loss detection against an independent reference — external anonymized customer study, 84 modules.

Different campaigns, different measurement tasks — no pooled product-accuracy figure. Full validation scope →

What SunSniffer Identifies

Every Lost Kilowatt-Hour Has a Reason.

Module-level TrueSTC™ data shows which modules changed, how the loss develops and where action creates value — some losses you recover, others you watch.

100%warranty floor · 80%expected · −0.4%/yrcrossed · year 12 of 25year 0year 25
TrueSTC™ trend · per module
Degradation
01

Continuous TrueSTC™ tracking identifies which modules are losing performance over time, at what rate, and whether degradation exceeds warranty thresholds. Early detection — before the claim window closes.

soiling −6% · cleaning pays back
Soiling & Shading
02

Soiling and shading appear as localized TrueSTC™ drops across specific rows or zones. Identify exactly where and when cleaning delivers a positive ROI — not based on a schedule, based on data.

warranty min · 90%14 modules · warranty reviewSTC-equivalent output →
TrueSTC™ distribution · 24,480 modules
Warranty & Quality
03

TrueSTC™ data provides the evidence base for warranty review — and for manufacturers, a continuous quality feedback loop from real field conditions. Know how your modules actually perform, not just how they tested in the lab.

From Loss to Yield · LossTrace + Ray

The Loss Is Measured. The Fix Is One Question Away.

Performance is loss, reversed. SunSniffer calculates loss down to every module, through every string, up to the inverter — Ray turns that list into a prioritized maintenance plan, and the ROI planner compares each action with your economic threshold. Four clicks, real plant:

SunSniffer Portal · Südstadt-Forum · live data
89%
Südstadt-Forum · plant health
260 of 292 modules healthy · 32 need attention · 15 safety actions
every row below is clickable ↓
🔥 SAFETY RISK15
◔ IEA PERFORMANCE IMPACT11
⬡ DIODEVITAL™ HARDWARE STRESS2

That is the easiest way to produce more: recover the yield you are already paying for.

The Business Case

Silent Loss Becomes the Baseline.

Small unnoticed losses do not disappear. They keep reducing production every day, while new losses are added on top. Set the sliders to your plant.

Your plant · 4 numbers
Plant size10MW
Undetected additional loss0.50% / yr
On top of normal warranty degradation — the recoverable part SunSniffer detects early.
Electricity price0.06€/kWh
Years unmonitored5yrs
Each year's unnoticed loss becomes part of the new baseline. Previous losses keep costing money while new losses are added.P(n) = P₀ × (1 − d)ⁿ
Unrecovered revenue loss before action
€44,701
What quietly leaks away if nobody acts for 5 years.
Output loss by year 5
−2.5%
Revenue leak in year 5
€1k / month
Annual revenue leak · each layer = the year a loss started · hover a bar
Older losses, still costingNew loss added that yearSimple one-year view
€5k/yr€10k/yr€15k/yrY1Y2Y3Y4Y5simple one-year view€15k/yr — the new baseline →

The ROI planner combines measured loss, energy value, remaining operating life and complete action cost — and shows which losses to watch, remediate or replace under your own economic threshold. See how a measured loss becomes a maintenance plan ↑
Why these numbers are realistic
IEA PVPS · Task 13
IEA PVPS
Documents real-world degradation rates consistently exceeding 0.7% per year across all module technologies — losses of 2–3% after a few years are the norm, not the exception.
ZAE / Helmholtz Laboratory References
TrueSTC™ was compared with laboratory flasher measurements from ZAE and the Helmholtz Institute Erlangen-Nürnberg: 0.82% mean observed absolute deviation across twelve comparisons of normally operating modules — all twelve within ±2%.
External Anonymized Customer Study
Soiling-loss detection validated against an independent Dust Detection System at approximately 0.9% — 84 sensorized modules, six strings analyzed in depth.
Read the Science
Next Step

Stop Estimating. Start Measuring.

The losses are already there. The only question is whether you can see them.

Book a 30-minute demo: we open a real plant in the portal and show you what it loses — module by module, in euros.

Book a Demo Read the Science
Free & non-bindingWith an engineer, not a sales deck